
Branded reports can feel like a chore–just another thing you’ve got to cram in by the end of the fiscal year. Too much data to gather, too many eyes to review, not enough time, and all the pressure to create an encyclopedic rundown of a year’s worth of your life’s work that you hope everyone will read.
Doesn’t sound fun.
But what if it could be?
I’m not saying to snap a few selfies, pull a some stats out of thin air and pop the champagne. I am saying that with time, intention and a dash of creativity, your report can be a page-turning tribute that you can be proud of.
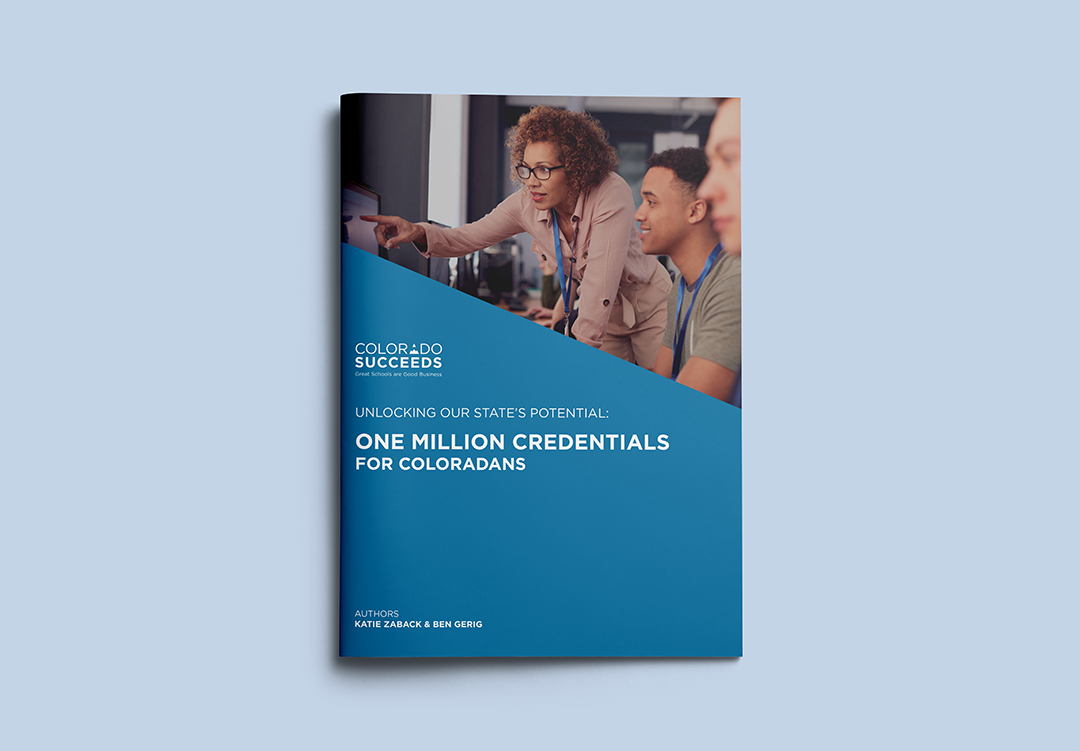
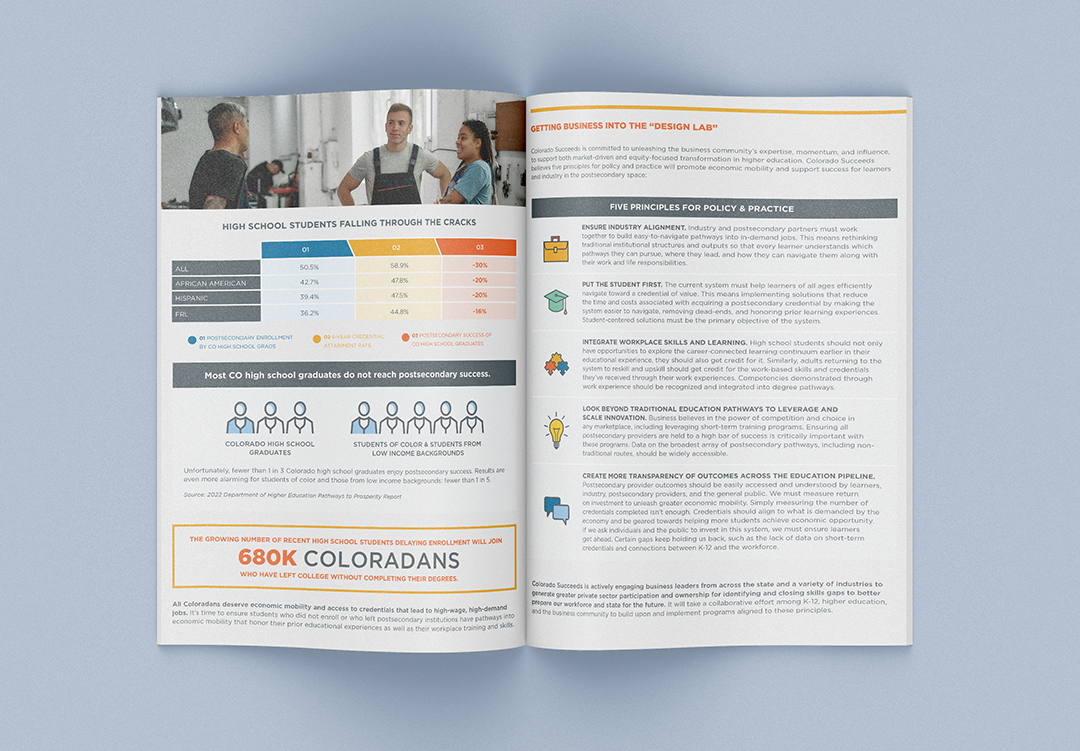
What makes an engaging report?
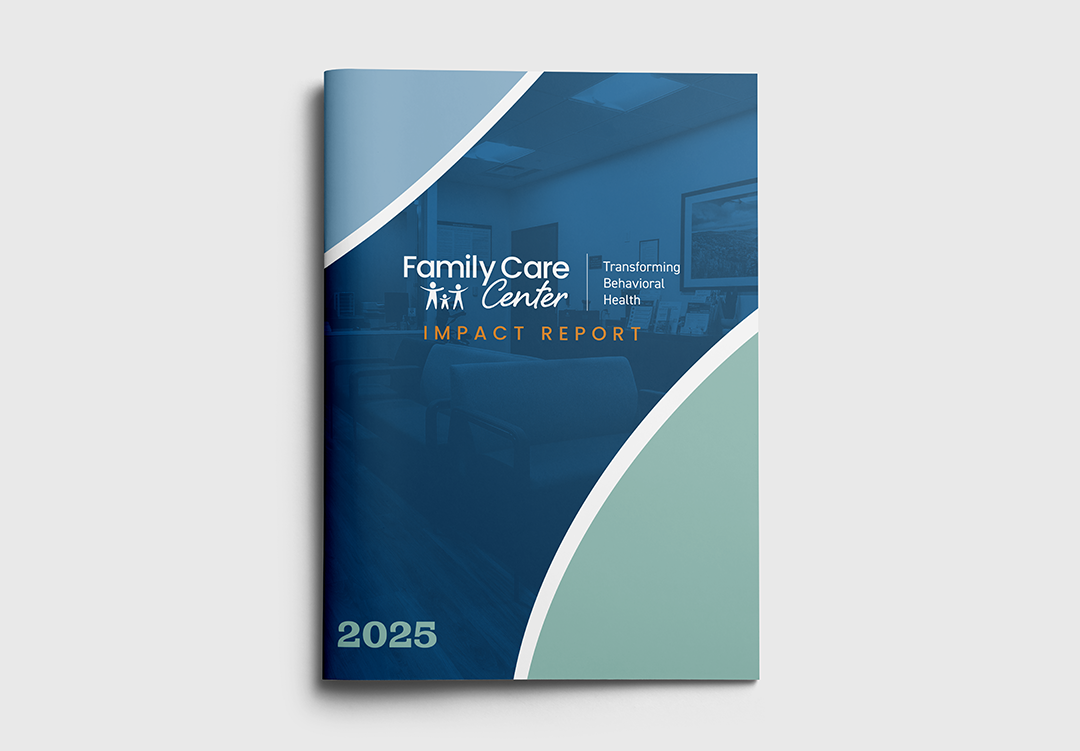
Every report is a special snowflake, but there are a few major design elements to consider every time:
- Colors – consistent but fun
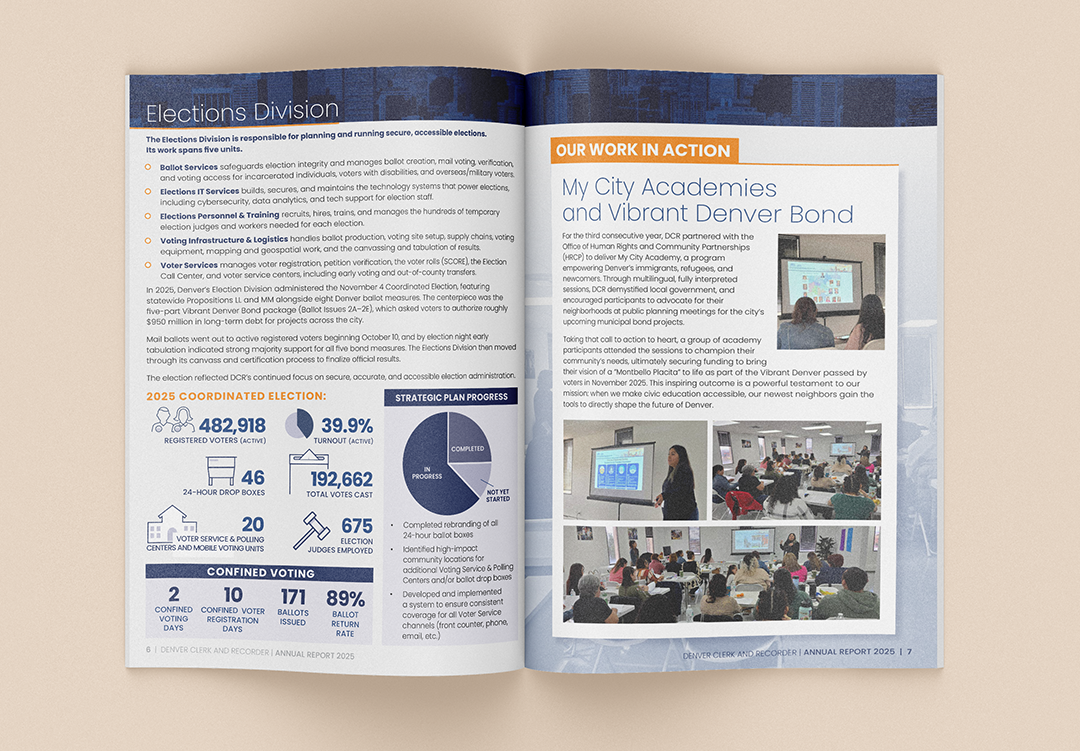
- Infographics – tailored to the data you’ve actually got to share
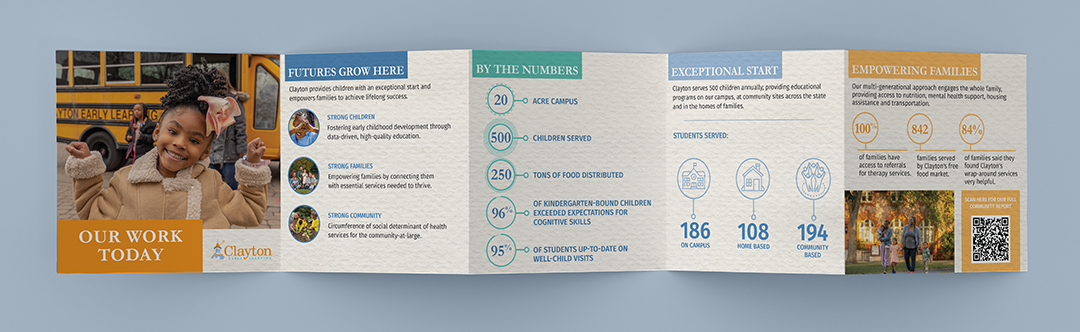
- White space – lots of it, artfully deployed, to give the info room to breathe
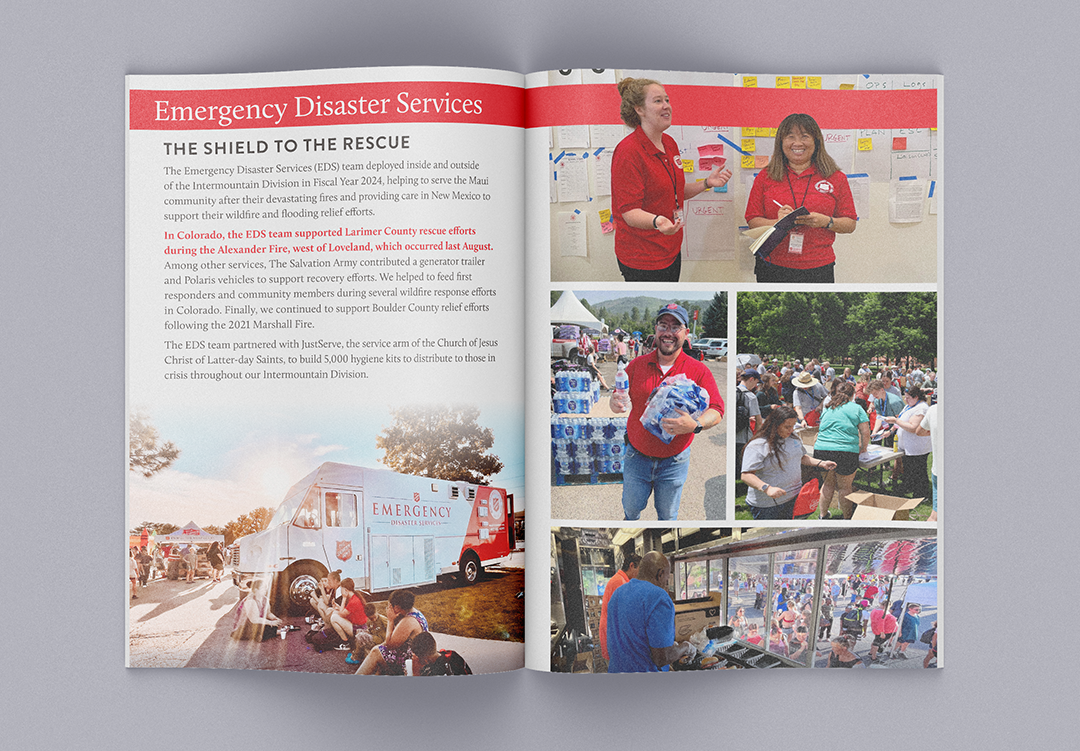
- Photography – authentic, polished, key to visual storytelling
Together, these are the ingredients that can draw the reader through your report, creating more of an experience than a slog.
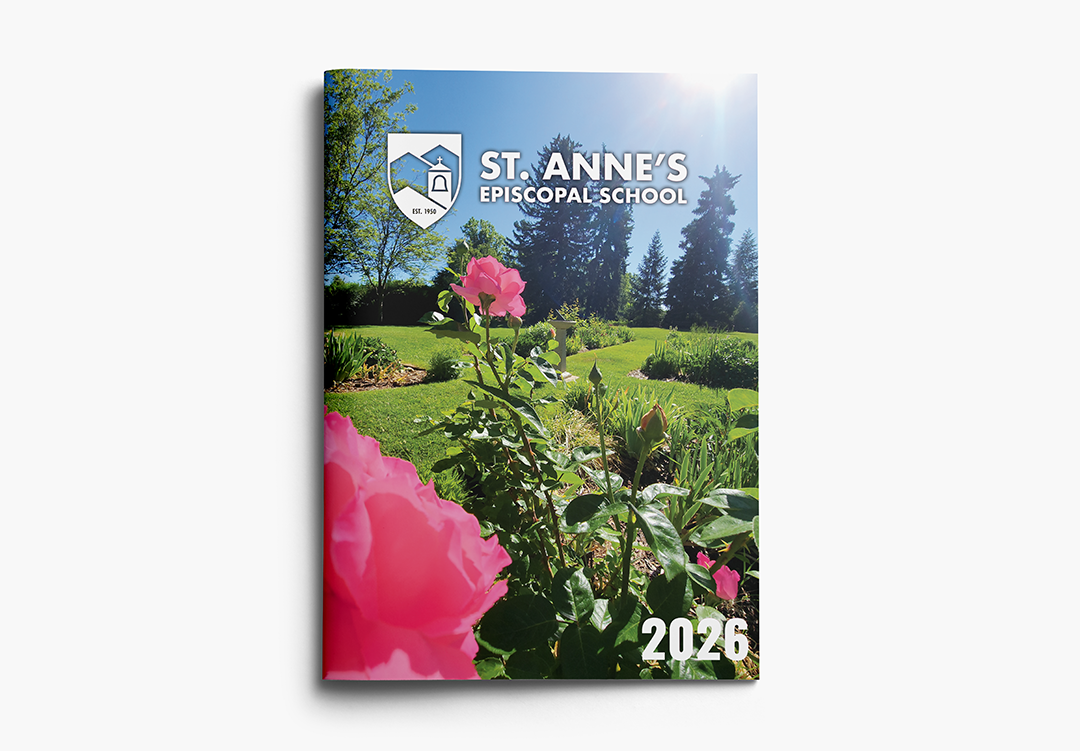
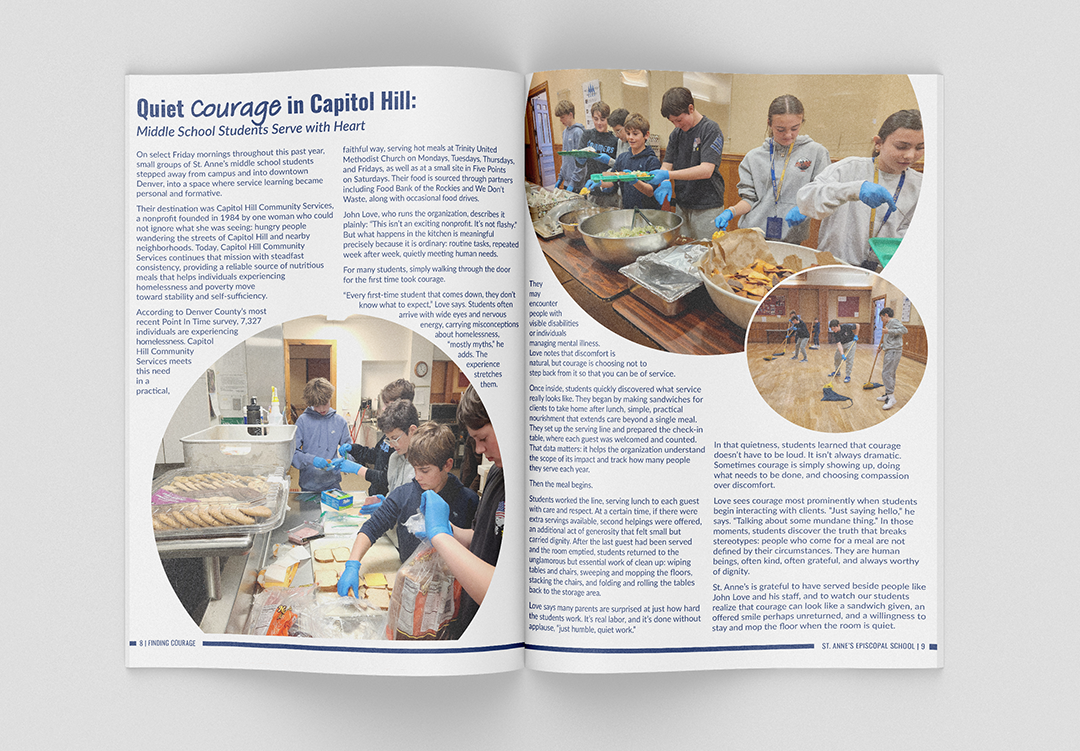
Push the envelope
If your year in business was a season of Dancing with the Stars, your report would be the finale free-style. You combine the fundamentals perfected over the regular season and add a splash of personality to make your report greater than the sum of its parts.
It’s not a time to toss the rule brand book. It’s a time to flex your creative muscles with a more design-forward approach than your standard letterhead.
Maybe add in one new font addition to call out key elements, a new complementary accent color, unique icon sets or motifs to bring movement to the reading experience. Those are the little details that demand attention and build your brand organically.
Start thinking about report design early
Like, really early. Things happen throughout the year that you’ll realize in hindsight would be great to include. As soon as one report is done, start a folder or a running doc with material for the next one. Photos, quotes, reactions, real-time data—collect it all and curate later.

Start writing your creative brief three to four months before your report needs to go out. That’s when you start getting stakeholders bought in, identifying key *metrics, and working toward final copy. This also gives you a chance to identify the photos, facts or stories you might be missing and allows time to go out and get them.
*Yup, metrics come early. Those numbers might still be changing, and that’s ok. We can always add in final numbers late in the design process or even tweak the actual data in an infographic. But we do need to know the metrics so we can set the stage with design.
Content first
Wait, a graphic design blog telling you not to think about graphic design first? Strange but true.
Sure, we can design a totally beautiful, totally fake report with dummy text and placeholder graphics. We can even give you word counts for each page and dimensions for ideal photos.
But we find that designing first doubles the cost and the time. The real design never looks exactly like the proof and clients often end up reaching for info they don’t have (or don’t need) just to fit the design.
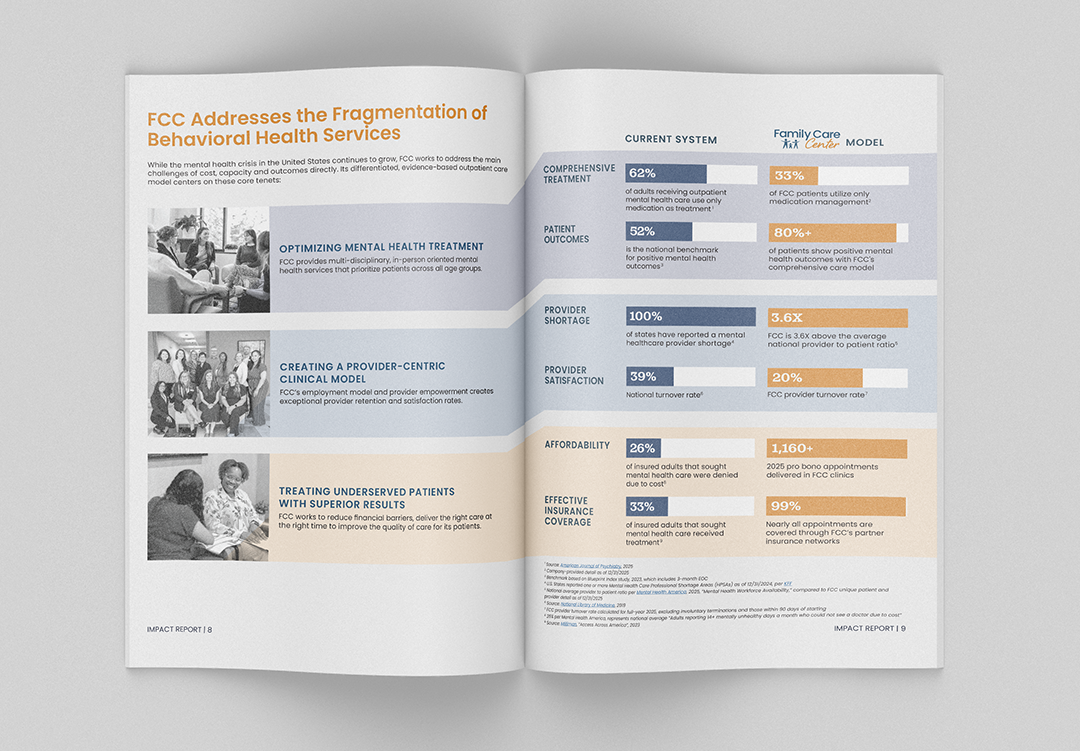
Instead, we recommend figuring out your content first and using that to inform a rough page count, leaving a bit of wiggle room for how things actually fit when design comes together. When we can design a report around real content, we can highlight the right things and build that journey that brings people along page by page.
Which brings us to report length.
Don’t stretch, don’t scrunch
There is no one correct size for report design. But there is a right size for the information you have to share. Some people get tied to page-count then find they don’t have the content to fill it. They end up repeating info which dilutes impact and seems like it matters less. On the flip side, trying to cram too much into a small format makes for a report that’s so dense it’s hard to get through.
It’ll always work out better when we can incorporate the right amount of information and white space based on what we’ve got, not what we’ve got to fill.
A picture is worth a thousand words
Brand photography is a super important element of report design. We highly recommend you don’t rely entirely on stock. Accurate, current, authentic photos really connect your community with the work you are doing.
Invest in professional photography when you have the budget and keep the report in mind throughout the year. That means snapping pics at the company picnic, volunteer outing, or big project reveal. Anything you’re telling people about in your report will land better if you can show them, too.
The digital divide: it’s not just a copy, paste.
More and more customers are looking to publish their reports digitally as well as in print, and we are all for it. Sharing your report digitally makes it more accessible and can build credibility with new audience members who might not be on your distribution list. Things break down, though, when the digital version is an after-thought.
We can always provide your final report design as a pdf that you can share on your website, with a few additional considerations:
- Live links – No one is clicking on urls in printed reports. Make sure they can when it’s digital.
- Alt. text – Embed descriptions in images for screen readers and legibility when images don’t load.
- Scrolling vs. page-flipping – If you want a special scroll effect or animations, you’ll need to budget for additional design time and coordinate with your web developer to get the right plug-ins in place.
You can do a lot with a digital-first report that wouldn’t translate to print, like interactive infographics, animated elements, even size, orientation and transitions. As long as you remember those things won’t magically appear when we save your print design as a pdf.
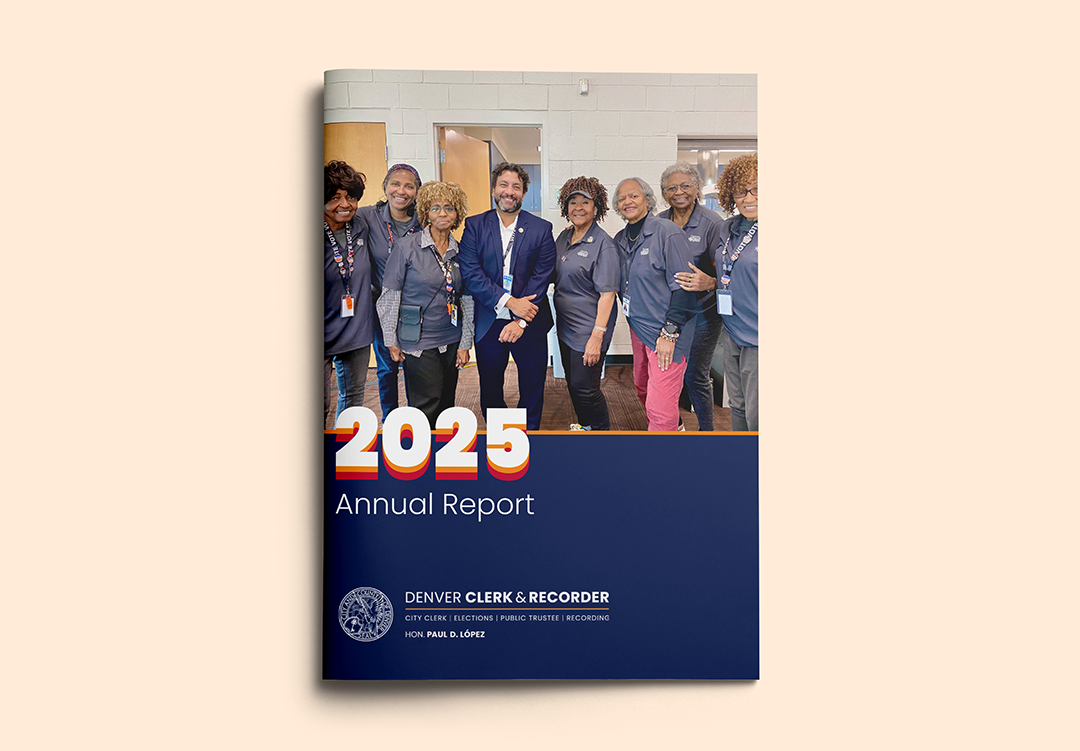
Accessibility in report design
Whether it is in print or online, your report information should be accessible to the broadest possible audience. That comes into play with your language choice—avoid jargon, define acronyms, prioritize short, clear sentence structure and consider translation.
Accessibility also matters in report design. Font sizes need to be legible with high contrast, and information should be presented in a way that leads people through it smoothly.
Report template considerations
Who even needs custom report design when there are a gazillion templates out there? Honestly, most of us.
A report template can be a great place to start. If you’re meeting minimal reporting requirements, operating on a shoe-string and have total discretion over what to include, the perfect template just might exist.
Emphasis on perfect. A report template’s got to match up with word counts, the data you have to present, photo count and orientation, all of it. Even the prettiest template is not necessarily designed for the story you have to tell.
It all depends on your content and your goals. We design many reports for stakeholders that want to see the value of a project they’re supporting (or considering supporting). Those include required investor disclosures, community impact statements or grant reports. In all of those cases, custom design goes a long way in communicating value. Smart readers will know a generic template when they see one.
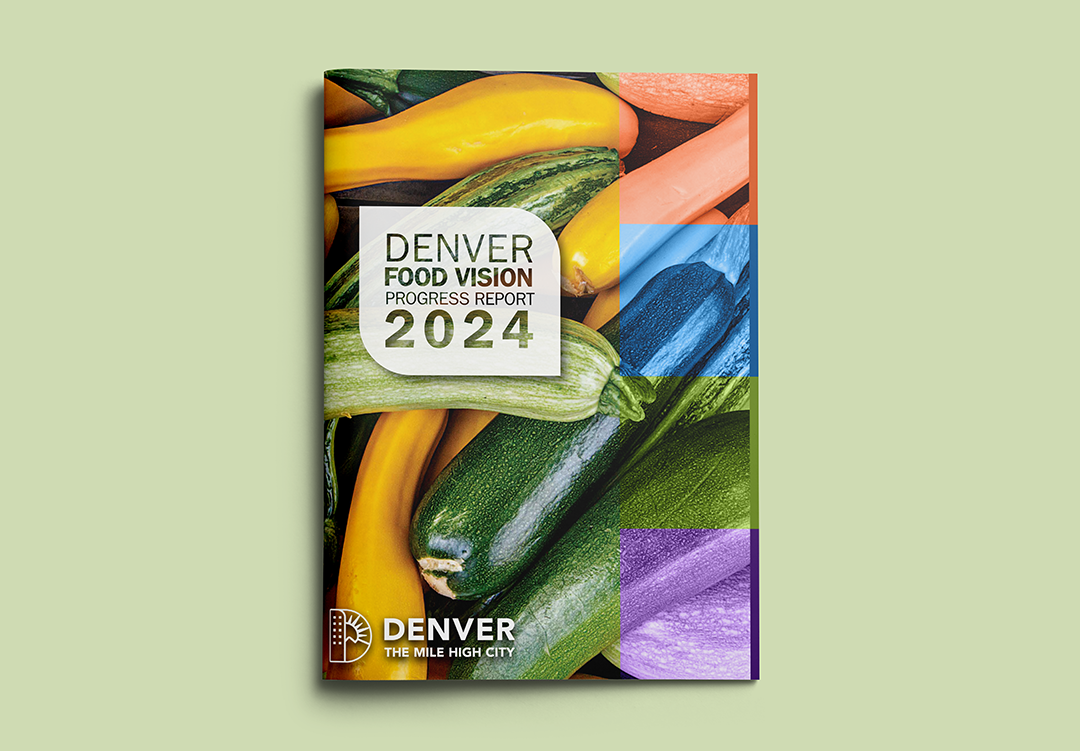
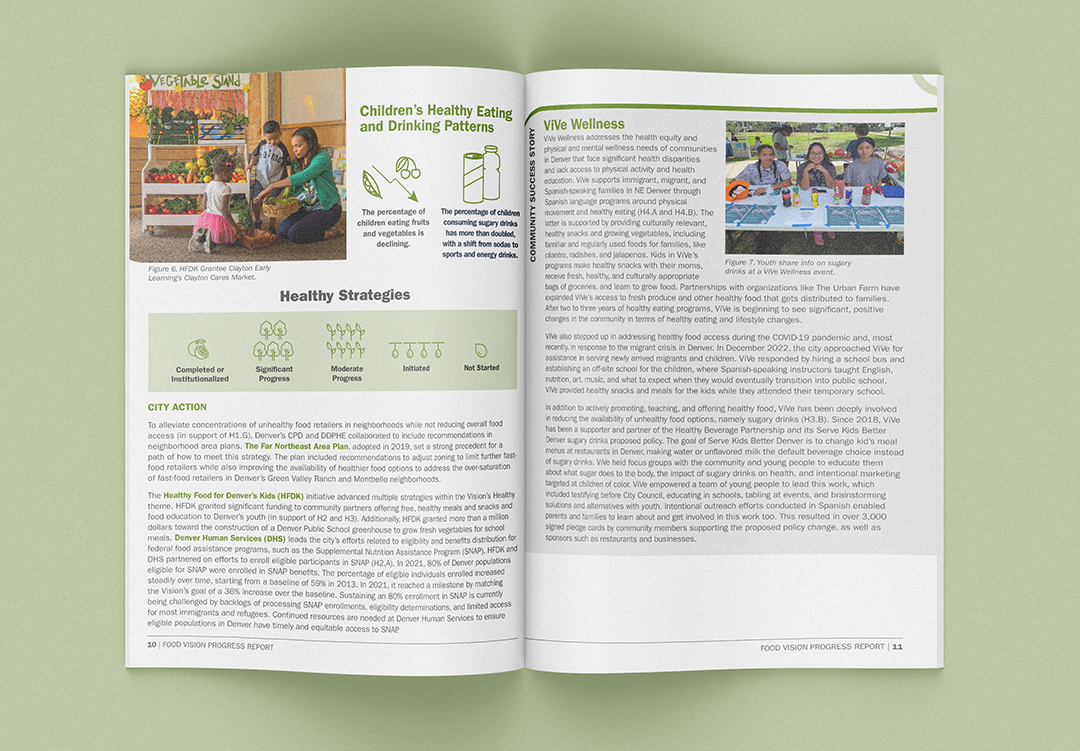
Plus, your custom report design becomes a template for the future. We learn together over time what works and what to expect. We (your design team) build on your brand identity and adjust within a proven framework. You (the client) also get a feel for length and design elements which makes it easier and easier to gather content and write to the layout.
Reporting for duty
We’re here to help you design and print your next branded report. Request a quote or email hello@yellowdogdenver.com to get started.